Improving JavaScript Performance for Web

JavaScript optimisation is becoming increasingly necessary for improving application performance. Let’s look at some of the challenges associated with JavaScript and how to optimise performance.
Why should we concern about JavaScript Performance?
JavaScript is a common language in mobile and web app development today. Nobody wants an app that crashes or a web page that is slow to load. The expectation for website load time has been around 2 seconds, or you will have to expect your visitors to leave.
What causes JavaScript to perform slow?
There are several areas that will have the biggest impact on both real and perceived performance in your site or app. We can look at a few separate types of JavaScript Performance issues:
- Slow parsing and compilation
- Render blocking
- Repaints and reflows
- Memory allocation
- Memory leaks
Slow parsing and compilation
Browsers need to parse and compile our code before they can run our code. Where possible this is done lazily to avoid spending time on code that will never run.
Parsing
The step where source code is turned into an intermediate representation to be consumed by a compiler (in V8, the bytecode compiler Ignition).
Critical path
Parsing and compiling happen on the critical path of web page startup, and not all functions shipped to the browser are immediately needed during startup.
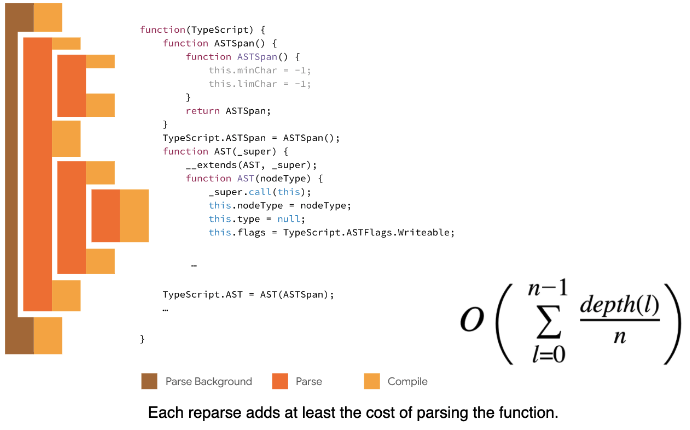
Source: Google V8
How soon a user can interact with your site can be delayed by the time in parsing/compiling code. The more JavaScript you send, the longer it will take to parse and compile it before your site is interactive.
Render Blocking
Render-blocking resources are portions of code in website files, usually CSS and JavaScript, that prevent a web page from loading quickly. These resources take a relatively long time for the browser to process, but may not be necessary for the immediate user experience. Render-blocking resources can be removed or delayed until the browser needs to process them.
This includes:
- CSS stylesheets
- JavaScript files added in the
<head>section - Fonts added from either CDN or a local server
- HTML imports (even though obsolete, you might still encounter them on legacy pages)
In order to reduce the number and impact of render-blocking resources, let's look at five strategies:
- Don’t add CSS with the @import rule
- Use the media attribute for conditional CSS
- Use the defer and async attributes to eliminate render-blocking JavaScript
- Split, bundle, and minify CSS and JavaScript files
Repaints and reflows
A repaint occurs when changes are made to an elements skin that changes visibly but does not affect its layout.
Examples of this include outline, visibility, background, or color. According to Opera, repaint is expensive because the browser must verify the visibility of all other nodes in the DOM tree.
A reflow is even more critical to performance because it involves changes that affect the layout of a portion of the page (or the whole page).
Examples that cause reflows include: adding or removing content, explicitly or implicitly changing width, height, font-family, font-size and more.
for (let i = 1; i <= 100; i++ {
    const p = document.createElement('p');
    p.textContent = 'Newly created paragraph element';

    document.body.appendChild(p);
}
The above code is very inefficient, causing 100 reflow processes for every new paragraph element appended.
You can mitigate this computationally stressful process by using .createDocumentFragment()
const fragment = document.createDocumentFragment();

for (let i = 1; i <= 100; i++) {
  const p = document.createElement('p');
  p.textContent = 'Newly created paragraph element';

  fragment.appendChild(p);
}

document.body.appendChild(fragment);
The above code will now instead only use the reflow process 1x for the creation of 100 new paragraph elements.
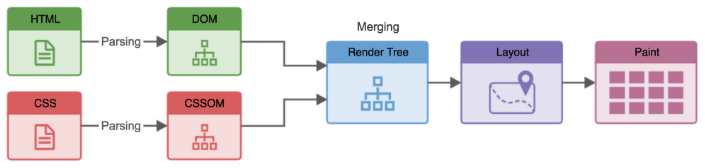
Reflow: compute the layout of each visible element (position and size).Repaint: renders the pixels to the screen.
Memory Allocation
Browsers have a finite amount of memory.
The exact amount varies by browser and device, and on modern browsers and new devices, it can be quite high. But it’s not unlimited.
Modern JavaScript applications tend to use a lot of memory, and it shows. After a while, the apps start to get slow and laggy and sometimes will freeze entirely. This is particularly noticeable in single-page apps.
The two biggest offenders:
- Lots of event listeners attached to individual elements
- Store huge amounts of data in memory
Modern frameworks encourage the bad practice of attaching event listeners directly on elements.
<button onclick="doSomething()">Click Me</button>
A better approach is to use event delegation, which greatly reduces the number of listeners in the browser memory.
Using Constructors and prototypal inheritance can also reduce the memory load for certain types of JavaScript libraries, particularly ones where the same methods and properties are shared by multiple items.
But large apps also tend to store huge amounts of state in memory.
const appData = {
  // every single detail about the current state of the application...
};
Across multiple views in a single-page app, the size of this in-memory data can grow rapidly so quickly. Storing state in the relevant component will help to control the size of the memory as those will be removed when the components unmount
Memory Leaks
The main cause of memory leaks in JavaScript is unwanted references. JavaScript's garbage collector uses an algorithm known as mark-and-sweep.
- The garbage collector builds a list of "roots". Roots usually are global variables to which a reference is kept in code. The window object is always present, so the garbage collector can consider it and all of its children to be always present (i.e. not garbage).
- All roots are inspected and marked as active (i.e. not garbage). All children are inspected recursively as well. Everything that can be reached from a root is not considered garbage.
- All pieces of memory not marked as active can now be considered garbage. The collector can now free that memory and return it to the OS.
There are three types of common JavaScript leaks:
- Accidental global variables
- Forgotten timers or callbacks
- Out of DOM references
Accidental global variables
One of the ways in which JavaScript is permissive is in the way it handles undeclared variables: a reference to an undeclared variable creates a new variable inside the global object. In the case of browsers, the global object is window. In other words:
function doSomething() {
  foo = 'this is a hidden global variable';
  // window.foo = "this is a hidden global variable";
}
If foo was supposed to hold a reference to a variable only inside the scope of the doSomething function and you forget to use const or let to declare it, an unexpected global variable is created. In this example, leaking a simple string won't do much harm, but it could certainly be worse.
Forgotten timers or callbacks
The use of setInterval is quite common in JavaScript. Other libraries provide observers and other facilities that take callbacks. Most of these libraries take care of making any references to the callback unreachable after their own instances become unreachable as well. In the case of setInterval, however, code like this is quite common:
const data = getData();

setInterval(function() {
    const node = document.getElementById('Node');
    if(node) {
        // Do stuff with node and data
        node.innerHTML = JSON.stringify(data));
    }
}, 1000);
This example illustrates what can happen with dangling timers: timers that make reference to nodes or data that is no longer required. The object represented by node may be removed in the future, making the whole block inside the interval handler unnecessary. However, the handler, as the interval is still active, cannot be collected (the interval needs to be stopped for that to happen). If the interval handler cannot be collected, its dependencies cannot be collected either. That means that data, which presumably stores sizable data, cannot be collected either.
For the case of observers, it is important to make explicit calls to remove them once they are not needed anymore (or the associated object is about to be made unreachable).
Most browserswill collect observer handlers once the observed object becomes unreachable, even if the listener is not explicitly removed. It remains good practice, however, to explicitly remove these observers before the object is disposed. For instance:
const element = document.getElementById('button');

function onClick(event) {
  element.innerHtml = 'text';
}

element.addEventListener('click', onClick);
// ...
element.removeEventListener('click', onClick);

// important!
element.parentNode.removeChild(element);
Now when an element goes out of scope, both element and onClick will be collected even in old browsers that don't handle cycles well.
Out of DOM references
Sometimes it may be useful to store DOM nodes inside data structures. Suppose you want to rapidly update the contents of several rows in a table. It may make sense to store a reference to each DOM row in a dictionary or array. When this happens, two references to the same DOM element are kept: one in the DOM tree and the other in the dictionary. If at some point in the future you decide to remove these rows, you need to make both references unreachable.
const elements = {
  button: document.getElementById('button'),
  image: document.getElementById('image'),
  text: document.getElementById('text'),
};

function doSomething() {
  image.src = 'http://some.url/image';
  button.click();
  console.log(text.innerHTML);
}

function removeButton() {
  // The button is a direct child of body.
  document.body.removeChild(document.getElementById('button'));

  // At this point, we still have a reference to #button in the global
  // elements dictionary. In other words, the button element is still in
  // memory and cannot be collected by the GC.
}
An additional consideration for this has to do with references to inner or leaf nodes inside a DOM tree. Suppose you keep a reference to a specific cell of a table (a <td> tag) in your JavaScript code. At some point in the future, you decide to remove the table from the DOM but keep the reference to that cell. Intuitively one may suppose the GC will collect everything but that cell. In practice, this won't happen: the cell is a child node of that table and children keep references to their parents. In other words, the reference to the table cell from JavaScript code causes the whole table to stay in memory. Consider this carefully when keeping references to DOM elements.
Summary
In this article we carefully looked at the issues that cause JavaScript performance and how to mitigate them for the following issues:
- Slow parsing and compilation
- Render blocking
- Repaints and reflows
- Memory allocation
- Memory leaks