The Chrome DevTools (Developer Tools), are a set web authoring and debugging tools built into Google Chrome. The DevTools provide web developers deep access into the internals of the browser and their web application.
This overview of DevTools points out the most popular and useful features. DevTools help inspect, debug and optimize Web applications. Following are a break down of features DevTools provide:Inspecting the DOM and styles
Inspecting the DOM and styles
- Working with the console
- Debugging JavaScript
- Improving network performance
- Improving rendering performance
- Improving JavaScript & CSS performance
- Inspecting Storage
Web Developer Toolbar
Chrome store location: Web Developer Toolbar
Adds a toolbar button with various web developer tools. The Web Developer extension adds a toolbar button to the browser with various web developer tools. This is the official port of the Web Developer extension for Firefox. The extension is available for Chrome and Firefox, and will run on any platform that these browsers support including Windows, OS X and Linux.

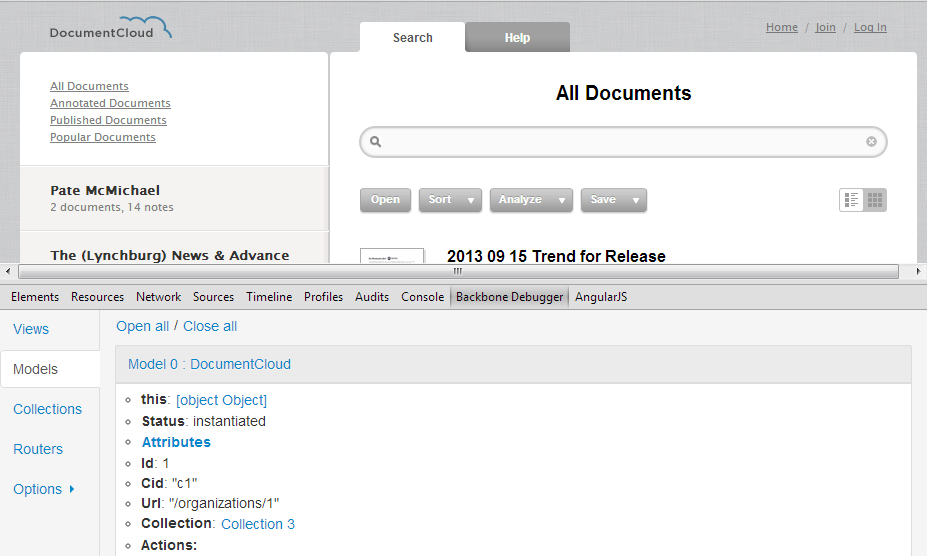
Backbone DevTools
Chrome store location: Backbone DevTools Backbone team hasn't done much for improving the tool itself but this is good enough for debugging Backbone.js apps. Following are the features provided by Backbone DevTools:
- Inspects views, models, collections and routers
- Detecst which objects have been instantiated
- Diaplys a very useful view" hierarchy in the Elements panel
- Inspect a DOM element and the closest View will be exposed via $view in the console."
Ember Inspector
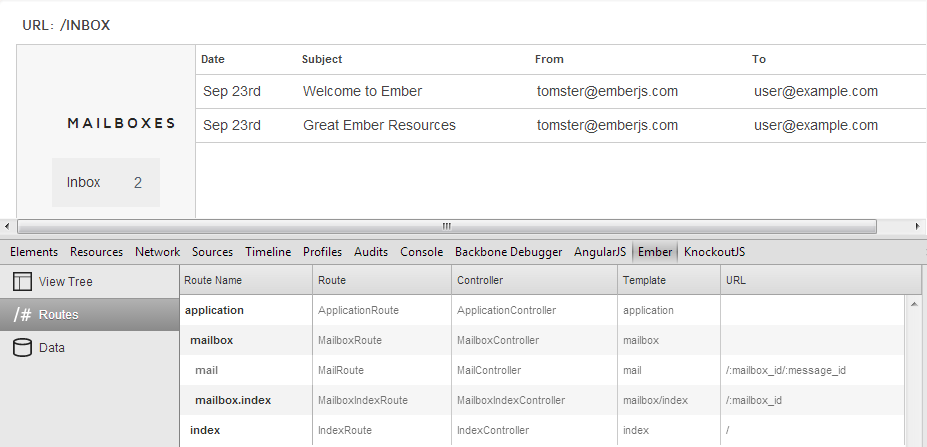
Chrome store location: Ember Inspector Yehuda Katz has been working on Ember Inspector, which improves Ember.js debugging workflow with easy inspection of controllers, views, and objects when running an Ember.js application. This tools provides features to get insights into models and their attributes, layers, bound computed properties and avoid the need to dig deep into the Ember object graph to figure out what is happening behind the scene."
Angular Batarang
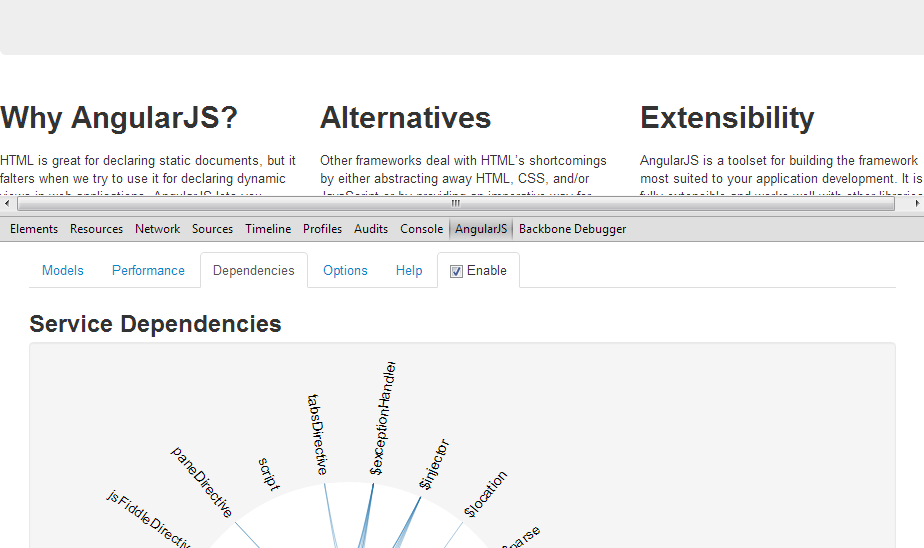
Chrome store location: Angular Batarang Angular Batarang(a superheroic tool that lives up to its name) is the most mature of the extensions you can find." The root scope(Scopes provide mechanism for watching the model and provide event processing life cycle) can get diffcult to trace ,so it's useful that it helps you to inspect nested scopes.
Angular Batarang provides following features:
- Visualise dependancies
- Debug applications
- Analyse performance of app extensions to address perfomance bottlenecks
- Get insights into models
- View DOM elements of a scope
- Inspect nested scopes
Thorax Inspector
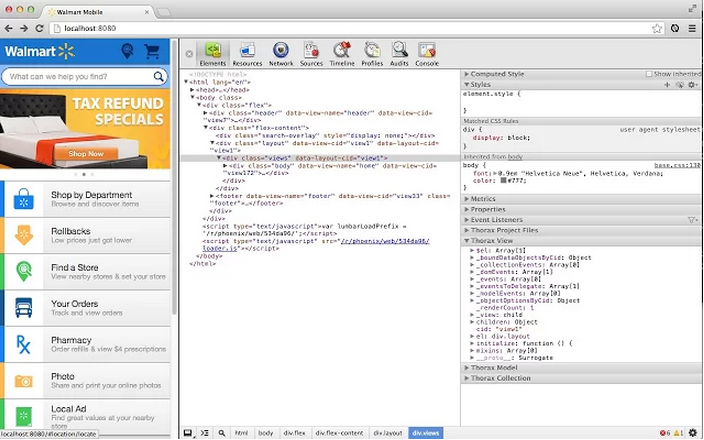
Chrome store location: Thorax Inspector Thorax Inspector is an inspector extension for Thorax, a Backbone + Handlebars framework to build large scale web applications.
This tool lets you inspect Thorax projects, Views, Models and Collections via the Elements panel."
KnockoutJS ContextDebugger
Chrome store location: Knockout Context Debugger
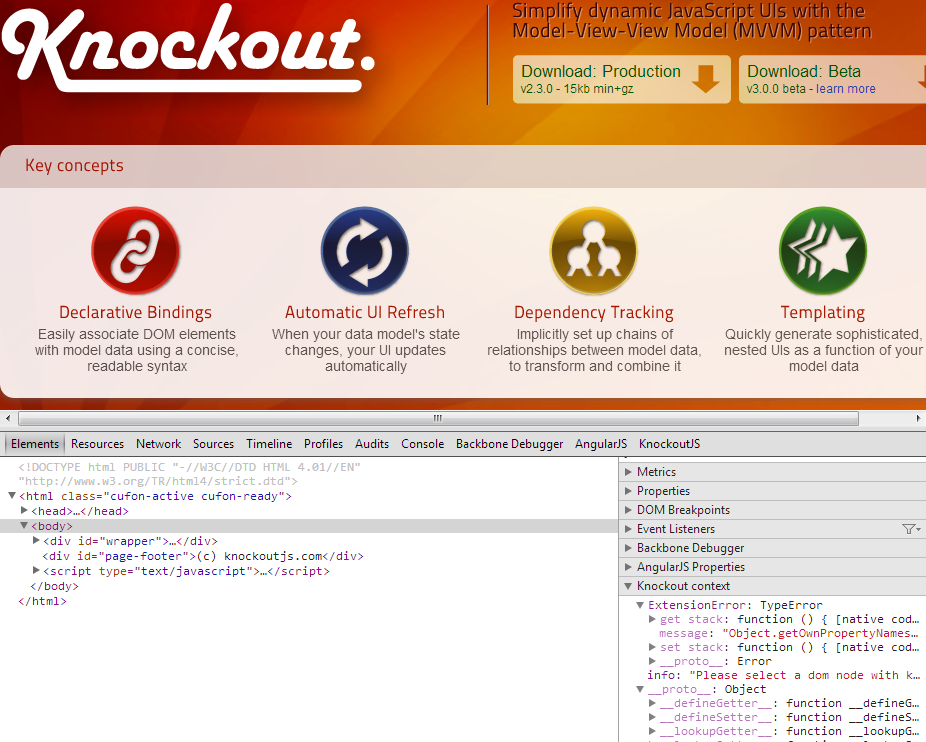
Knockoutjs Context Debugger shows the knockout context & data for the selected DOM node in a sidebar of the elements pane. Knockoutjs debugging extension adds a extra sidebar in the elements pane of the chrome dev tools with the relevant knockout context and data for the selected element. Very usefull if you got large/nested viewmodels. Allows to add tracing to every observable/computed.
Rails Panel
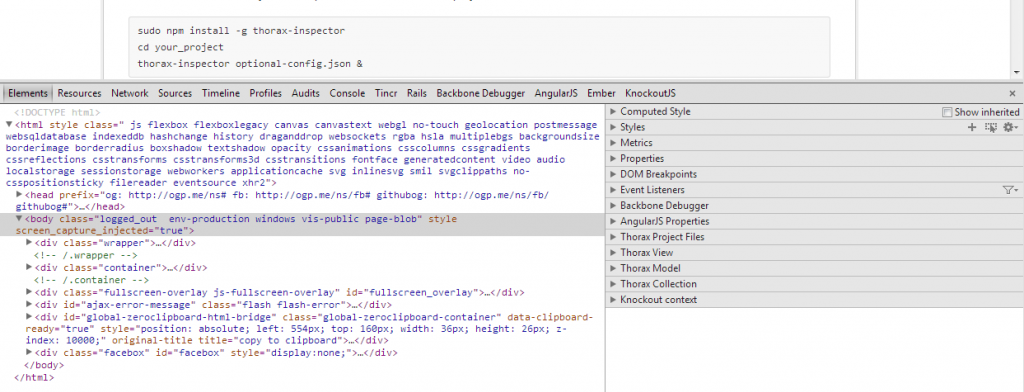
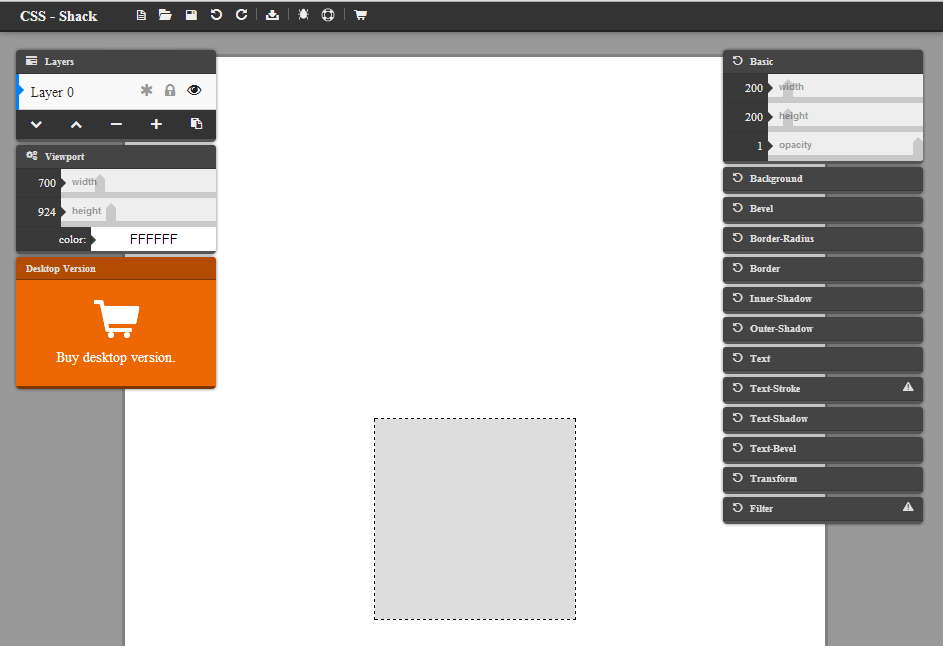
Chrome store location: Rails Panel RailsPanel is a Chrome extension for Rails development that will end your tailing of development.log. Have all information about your Rails app requests right there in the Developer Tools panel. Provides insight to db/rendering/total times, parameter list, rendered views, text editor integration and more. To use this extension you need to add meta_request gem to your app's Gemfile: group :development do gem 'meta_request' end Tincr Chrome store location: Tincr Extension to allow editing and fast reloading of local files from Chrome developer tools The idea behind Tincr is that you can save changes to your original source file from within Chrome Developer Tools. In addition, Tincr does auto-reloading of JavaScript and CSS changes made in other editors. CSS-Shack Chrome store location: CSS-Shack CSS-Shack allows you to create Layers Styles (just like you would in any other image editing software), and export them into a single CSS file, or copy them to the clipboard. You can create website designs, mockups or just simple button. Notable features :
- Fully CSS3 compatible
- Images support
- 11 filters
- Works offline
Others
There are more extensions and helpers out there. Following are few of them:
- PrettyPrint - Unminify JavaScript and CSS automatically when using view-source
- JS Runtime Inspector - For easily grepping JavaScript objects from the Elements panel
- JetBrains IDE Support - Live editing and see real-time changes in Chrome when used with WebStormIDE